Check out my infographic on the UK public’s attitude to Climate Change and the need to act, taken from recent Government Surveys.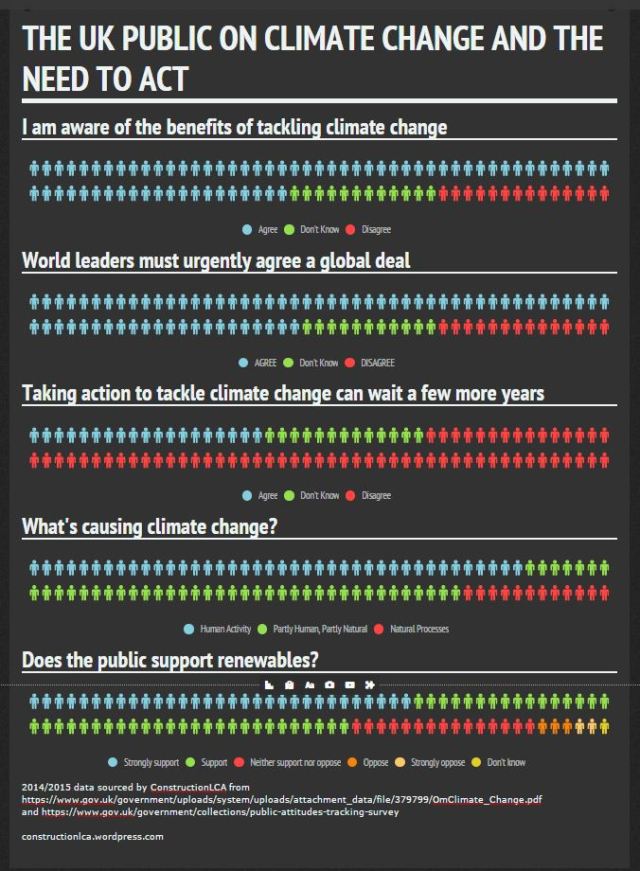

Check out my infographic on the UK public’s attitude to Climate Change and the need to act, taken from recent Government Surveys.
“Our new report ‘Forecast Changeable’ shows how climate change is a growing conservation challenge to our land, collections, houses and gardens.
The report illustrates how we have had to explore new ways to manage our properties in the face of a changing climate. Some have become damaged by rainwater and flooding and our gardens are increasingly affected by drought and disease.
The effects of these changes are not confined to one region; they are in evidence across the country. For example, at Nymans in West Sussex, drought issues meant water storage capacity had to be doubled to 80,000 litres. Increased demand necessitated that this be raised to 150,000 litres. Because the system ran dry this summer we must again increase capacity so if it stops raining in April, the garden has enough water to last through the summer.
The Plant Conservation Centre, which is responsible for grafting and propagating important collections for our gardens, has become a victim of warmer winters. The period of time available for grafting has been cut in half, making the procedure only possible in the cooler periods from January to March. A second facility was opened to accommodate the climatic change.
And at the Vyne in Hampshire, because of wetter weather and intense rainfall, water leaked through the windows into some of the most historically important rooms in the mansion. This damaged six Soho tapestries, dating to 1710, which cost £60,000 to repair. Major renovation work is now needed to protect this Grade I listed mansion and its contents from further damage.
There are other financial costs of increasingly extreme weather events. The number of insurance claims we have made increased from three in 2005, to seven in 2015. Over the past decade, our monthly claim values have risen more than fourfold.
These examples show how we must drive innovation in order to adapt to unpredicted changes in our climate. We have also set ourselves challenging energy targets and are committed to reducing our carbon emissions whilst sharing lessons learned with others. It is now time for political leaders to deliver a joined up approach to emissions reduction to address the impacts of climate change.”
His comments come in a television interview with Sky News to be shown on Monday evening but recorded before the Paris attacks. From BBC News.
Prince Charles told Sky News: “We’re seeing a classic case of not dealing with the problem because, it sounds awful to say, but some of us were saying 20 something years ago that if we didn’t tackle these issues you would see ever greater conflict over scarce resources and ever greater difficulties over drought, and the accumulating effect of climate change, which means that people have to move.
Asked if there was a direct link between climate change, conflict and terrorism, he added: “It’s only in the last few years that the Pentagon have actually started to pay attention to this. It has a huge impact on what is happening.
“The difficulty is sometimes to get this point across – that if we just leave it and say, well there are obviously lots of, there are endless problems arising all over the place therefore we deal with them in a short-term way, we never deal with the underlying root cause which regrettably is what we’re doing to our natural environment.”
Asked in the interview whether the world could afford to deal with climate change at a time of austerity, the prince said: “The trouble is if we don’t, this is the awful thing, if we don’t it’s going to get so much worse, then life will become very, very complicated indeed, and what we’re experiencing now will be as nothing to the problems. I mean the difficulties in 2008 with the financial crash – that was a banking crisis. But we’re now facing a real possibility of nature’s bank going bust. If you see it like that, we’ve been putting so much pressure on the natural systems and all those aspects of nature that we take for granted.”
BREEAM provide information on their proposed consultation on BREEAM Infrastructure to inform the development of CEEQUAL v6 (or BREEAM Infrastructure – I wonder which brand will win out there?)
BRE have just announced that they have purchased CEEQUAL and will take over the running of the scheme. CEEQUAL say “Over the next two years BRE will, with the involvement of the current CEEQUAL and BREEAM delivery teams and communities, combine the best elements and features of both approaches into a new and improved holistic scheme for industry that combines CEEQUAL’s team and process-focussed approach with BREEAM’s more asset-based scientific methodology”
So why do I question BREEAM’s scientific methodology? The reason is that the scores for various credits seem to reward some actions in a way which does not reflect the actual environmental impact of the action.
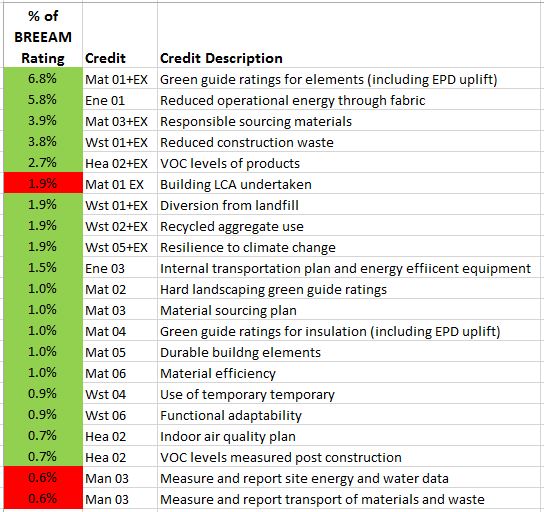
As you can see from the table above, which covers Materials Related BREEAM 2014 credits, weighted for a Fully Fitted Out building, the greatest score can be obtained by using building elements with a Good Green Guide rating. However, some of this score can come from the use of products with Environmental Product Declarations. This might show that the product used is the terrible in terms of environmental impact, but the Mat 01 uplift points will still be awarded.
Where I really question BREEAM however is in the weighting given to construction waste. It is possible to obtain 3.8% of a perfect BREEAM Score by reducing construction waste to exemplary levels (Wst 01). This is excellent, and performance based. But with construction waste being between 2 and 10% of materials used, does it really merit half the BREEAM score from specifying low impact building elements (8.8%)? Additionally, if you recycle exemplary levels of what construction waste you do produce, you are able to obtain a further 1.9%, meaning you can obtain almost as much reward for doing something good with less than 10% of the materials used, compared to the reward for what materials are used in the first place. If BREEAM was scientific, it would not be possible to obtain more than 10% of the Mat 01 score from Wst 01.
Similarly, 1.9% is available by specifying exemplary levels of Recycled Aggregates. Recycled aggregates are already considered within the Green Guide ratings for upper floors, concrete structure and hard landscaping, so this is a double counting of benefit. On top, does the use of recycled aggregate really merit about 30% of the score for specifying low impact materials for walls, floor, roof and hard landscaping?
The same is true for insulation which has 1% compared to 6.8% for the other building elements. Many studies have shown insulation has a tiny influence on the embodied impact of the building – its major effect is in reducing operational impacts – but BREEAM focusses heavily on the embodied impacts of insulation using Mat 04 without any scientific basis.
Hopefully, through the process of consultation as BRE now develop CEEQUAL v6/BREEAM Infrastructure, it will be possible to ensure that the credit structure has a more scientific basis. But evidence from BREEAM 2014 shows that credits are more often weighted towards aspects which can be easily measured, or which ensure BRE business from Green Guide ratings, rather than on the basis of impact.

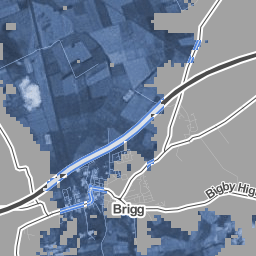
Climate Central have produced some terrifying images showing cities around the world after 4° of warming and 2° of warming. I’ve included the photo of London, and you can also use their interactive mapping tool to see exactly what it will mean for your location. Below I’ve included the map for Brigg, my local town in North Lincolnshire, after 2° of warming – it will pretty much wipe out the town, and much of the agricultural land around it. Remember, 2° is what we are aiming for at Paris, with current commitments, we are going to go beyond this. This is why Paris is so important – we are quickly reaching the point at which increasing temperature cannot be reversed.
BSI are currently looking for comments on the draft of Publicly Available Specification 2080 which covers the calculation of embodied carbon and operational carbon, or as the PAS calls it, Capital and Operational Carbon for Infrastructure. According to BSI, the objective for PAS 2080 is “to set out a generic, specification for economic infrastructure GHG emission management, founded on currently accepted proven practice and taking account of existing international and sector norms and standards to provide a comprehensive, pragmatic approach to controlling/ reducing, GHG emissions created by infrastructure projects.”
The draft can be viewed and comments made online at http://drafts.bsigroup.com/Home/Details/55613 (registration necessary).
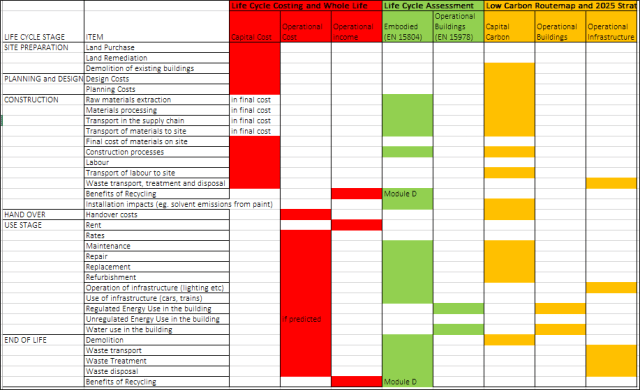
Figure 1: comparing Capital Cost, Embodied Carbon and Capital Carbon, from my thinkstep blog from October 2014.
In my thinkstep blog, I provided an overview of the differences between Embodied Carbon (as assessed using the Global Warming Potential indicator provided in EPD to EN 15804 and building LCA’s to EN 15978) and Capital Carbon, as described in the Low Carbon Routemap and the 2025 Construction Strategy, shortly to be updated with more focus on whole life carbon. As you can see from the diagram above, there were some key differences.
Although both Capital Carbon and Embodied Carbon encompass the environmental impacts associated with manufacturing, transporting and installing construction products, Capital Carbon also took into account the impacts of the design teams working on buildings (assessed to be about 5% of the construction industry impact (see Figure 2 below) and the transport of workers on the construction site (with construction product distribution assessed to be about 10% of construction industry impact). But significantly, for infrastructure, the impacts of waste transport, treatment and disposal were included, but were reported as Operational Carbon rather than Capital Carbon .

Figure 2: Capital Carbon emissions in 2010 (MtCO2e) from Green Construction Board Low Carbon Routemap Report
The good news however, is that PAS 2080 has more closely followed the CEN/TC 350 standards and all impacts associated with construction of infrastructure, including waste treatment of construction waste and the end of life of the asset are now considered as Capital Carbon.
And however Capital Carbon and Embodied Carbon are defined, for construction products, the key piece of information is that the GWP indicator results provided in an EPD to EN 15804 can be used for buildings and infrastructure assessments, and the modular nature of the data provided in the EPD, together with the descriptions of any scenarios used, allows the relevant processes to be considered as required in any assessment, to EN 15978 or PAS 2080, or the CEN/TC 350 framework standard for infrastructure assessments which has just been launched.
The new syllabus for GCSE Chemistry, to be taught in schools from 2016 for examination in 2017, will now cover Life Cycle Assessment (LCA). If take-up stays the same, this should mean around 125,000 children in 2017 will have a knowledge of LCA gained through this route.
The exact requirement is as follows:
“Life cycle assessment and recycling
However, strangely given the focus at GCSE, the syllabus for the revised Chemistry AS and A levels does not include any mention of Life Cycle Assessment.
In GCSE Design and Technology for teaching from 2017, the students will need to demonstrate their knowledge of science, including
Life cycle assessment and recycling: eg. the basic principles in carrying out a life cycle assessment of a material or product, with an example of the use of this skill being “selection of materials and components based on ethical factors, taking into consideration the ecological and social footprint of materials.”
Currently just under 200,000 children take this GCSE, 4% of the GCSEs taken in 2015.
At present, LCA is normally taught as part of Post Graduate Degree courses, though there are some undergraduate courses covering it. Given most LCA practitioners consider interpretation of LCA data to be one of the most difficult parts of LCA, it will be interesting to see how Schools take forward the teaching of LCA and its interpretation – something even LCA practitioners recognise to be difficult.
I’m just in the process of becoming a STEM Ambassador, so I hope this will be something that I will be able to help with locally.
And of course, the teaching of LCA, or just the concept of embodied carbon remains something that could be given more focus in Architecture, Engineering and Construction Degrees.
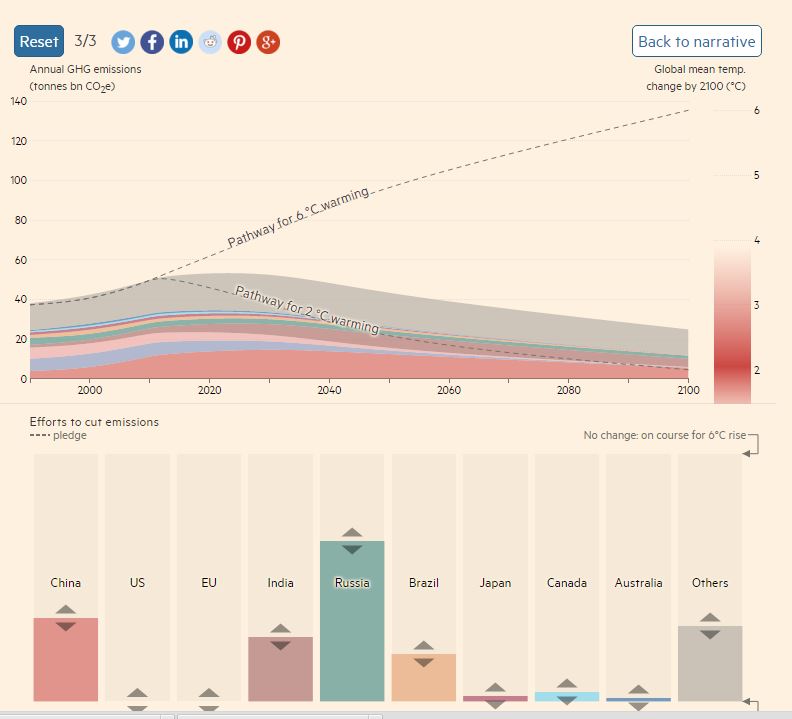
See how close we’ll get with current commitments and change targets to see what happens.
An expert in Life Cycle Assessment for the Construction industry
